Tue, Jul 8, 2025
Volume 8 - Special Issue
Iran J Neurosurg 2022, 8 - Special Issue: 0-0 |
Back to browse issues page


Download citation:
BibTeX | RIS | EndNote | Medlars | ProCite | Reference Manager | RefWorks
Send citation to:


BibTeX | RIS | EndNote | Medlars | ProCite | Reference Manager | RefWorks
Send citation to:
Seddighi A S, Seddighi A, Ghadirian M, Zali A, Ommi D, Tabatabaei Far S M, et al . The Benefits and Implementation of Diffusion Tensor Imaging and Neural Fiber Tractography in Brain Surgery. Iran J Neurosurg 2022; 8 : 5
URL: http://irjns.org/article-1-298-en.html
URL: http://irjns.org/article-1-298-en.html
Amir Saied Seddighi1 

 , Afsoun Seddighi *2 , Mahsa Ghadirian1 , Alireza Zali1 , Davood Ommi1 , Seyed Mahmoud Tabatabaei Far1 , Hamid Reza Azizi Faresani1 , Nooshin Masoudian3
, Afsoun Seddighi *2 , Mahsa Ghadirian1 , Alireza Zali1 , Davood Ommi1 , Seyed Mahmoud Tabatabaei Far1 , Hamid Reza Azizi Faresani1 , Nooshin Masoudian3
1- Functional Neurosurgery Research Center, Shohada Tajrish Comprehensive Neurosurgical Center of Excellence, Shahid Beheshti University of Medical Sciences, Tehran, Iran
2- Functional Neurosurgery Research Center, Shohada Tajrish Comprehensive Neurosurgical Center of Excellence, Shahid Beheshti University of Medical Sciences, Tehran, Iran ,afsounseddighi@gmail.com
3- Department of Neurology, Faculty of Medicine, Qazvin University of Medical Sciences, Qazvin, Iran
2- Functional Neurosurgery Research Center, Shohada Tajrish Comprehensive Neurosurgical Center of Excellence, Shahid Beheshti University of Medical Sciences, Tehran, Iran ,
3- Department of Neurology, Faculty of Medicine, Qazvin University of Medical Sciences, Qazvin, Iran
Keywords: Diffusion tensor imaging, Fractional anisotropy, White matter tractography, Diffusivity, Tensor model, Tract
dispersion
Full Text [PDF 1028 kb]
(1057 Downloads)
| Abstract (HTML) (2255 Views)
Full Text: (1203 Views)
1. Introduction
Brain function is highly associated with the wiring between variant brain regions, and signals transported by the complex web of axons from one neuron to another. Apart from methods aiding in the detection of brain activation by functional MRI (fMRI), MRI is crucial because it offers a choice to measure the underlying anatomical connections, through which extremely fast interactions among neurons are possible. The neurons perform various functions in the brain. In a small region of white matter, the bundles of the axonal fibers are all aligned. The direction of such alignment can be gently measured using diffusion tensor imaging (DTI). Understanding the orientation of the fibers at each point is requisite to mapping the fiber tracts. This method uses the sensitivity of the magnetic resonance signal to the small random motions of water molecules. Due to the existence of diffusion in white matter fiber tracts, water molecules have more tendencies to displace along the fiber direction compared with a perpendicular direction; in which diffusion anisotropy has been specifically raised, and mapping the fiber orientation with DTI is possible. Considerably, besides mapping white matter fiber tracts, these methods can enable us to detect and characterize white matter disorders in disease [1].
DTI is a recently developed MRI technique that can measure macroscopic axonal organization in the nervous system, and it will be one of the noninvasive ways to understand brain structural connectivity [2]. DTI also provides image contrast using the directional diffusion rate of water molecules within the brain [3]. One of the pivotal aspects of applying DTTI is the visualization of white matter tractography (WMT) and fundamental aid in the surgical planning for patients with intrinsic brain tumors [4].
Tractography has been raised as a significant method to improve the extent of tumor resection that surely liaises with longer survival. However, there is always a probability of tumor relapse. Primarily, MRI by focusing on cortical structures can precisely illustrate brain tumors, also the connection of the tumor with crucial brain structures, including blood vessels, but about the subcortical gray matter and the urgent region surrounding tumors, there is an obvious weakness in indicating exact information about entanglement and entirety of WMT. Fortunately, diffusion anisotropy maps and DTI modality can obtain a wealth of information in the white-matter tracts [4].
The concentration of this article is on DTI quiddity, its particular computational techniques, investigating its precision and interpretation, clarification of these WMT dispersions, and assessment of tract confidence. Undoubtedly, having complete acquaintance with all these comprehensions equips the neurosurgeons for preoperative planning. Tractography analysis has been competently discussed in this paper as well. Furthermore, consideration of functional connectivity and fiber clusterization among large tractography datasets is discussed in our paper. The only confined clinical aspects of the application of tractography in diseases have been discussed.
2. Methods and Materials/Patients
Basic diffusion tensor imaging (DTI) concepts
DTI is a recently developed MRI technique that can measure macroscopic axonal organization in the nervous system, and it is one of the noninvasive ways to understand brain structural connectivity [2]. DTI also provides image contrast using the directional diffusion rate of water molecules within the brain. When we see white matter on the MRI, a homogeneous gelatinous substance exists called the white matter, and no information about nerve tracts is available. A creative method called DTI illustrates how the tracts of white matter get through the brain. Diffusion occurs due to Brownian motion and random thermal motion. This diffusion can be isotropic or anisotropic. There is high isotropic diffusivity in cerebrospinal fluid (CSF) and an isotropic diffusivity in the gray matter but high anisotropic diffusivity in the white matter. Image intensities are inversely proportional to water molecules in tissue and motion orientation. Despite naturally moving water molecules under Brownian motion in an isotropic medium, e.g. water glass, the diffusion in biological tissues is often anisotropic [5]. Low contingency to crossing a myelin membrane by a supposing molecule through the axon can be a sample in this case. It can be comprehended by applying a specific gradient in a given direction wherever the dark regions correspond to non-Brownian motion.
Anisotropy and diffusion tensors
DTI facilitates measuring the quantity of water diffusion within brain tissue. Three perpendicular vectors portray the diffusion of each image voxel. Indeed, isotropic diffusion corresponds to no restriction to water movements, including CSF and ventricles, while anisotropic diffusion corresponds to restricted water movement in one primary direction, including myelinated fibers.
The angular frequency of the MR signal (ω) and the magnitude of the magnetic field (B) are related by the equation of ω=γ B where the magnitude of the magnetic field (B) and the magnet strength (B0) have this relationship: B=(B0+G*distance). Also, in Figure 1.B.
.jpg) the effect of a gradient pulse is schematically depicted by applying a Y gradient and measuring signals from water molecules in two different positions along the Y-axis. These different positions were represented by red and blue circles. Four separate periods were considered to illustrate these remarkable effects. In period I, analogous magnet strength was applied thus identic signal frequencies were obtained from all water molecules. While in period II, we observe the initiation of resonating at a lower frequency for water molecules in the blue position by exerting the Y gradient. Following to being terminated the gradient pulse, the water molecules tend to have the same frequency build-up, although their phases are never the same. Therefore, a phase difference with a short period of a gradient pulse occurs depending on the location of the molecules along the gradient axis. Finally, in period IV, unwinding the phase difference is desired; it is possible to apply another Y gradient with the opposite polarity. Commence to resonate at a higher frequency for water molecules in the blue location are visible [2].
the effect of a gradient pulse is schematically depicted by applying a Y gradient and measuring signals from water molecules in two different positions along the Y-axis. These different positions were represented by red and blue circles. Four separate periods were considered to illustrate these remarkable effects. In period I, analogous magnet strength was applied thus identic signal frequencies were obtained from all water molecules. While in period II, we observe the initiation of resonating at a lower frequency for water molecules in the blue position by exerting the Y gradient. Following to being terminated the gradient pulse, the water molecules tend to have the same frequency build-up, although their phases are never the same. Therefore, a phase difference with a short period of a gradient pulse occurs depending on the location of the molecules along the gradient axis. Finally, in period IV, unwinding the phase difference is desired; it is possible to apply another Y gradient with the opposite polarity. Commence to resonate at a higher frequency for water molecules in the blue location are visible [2].
B-value is a term 1st introduced in 1965 by Stejskal and Tanner in their pulsed gradient diffusion approach. It has been delineated as a basic technique for most modern diffusion-weighted image (DWI) pulse sequences. It particularly demonstrates the level of diffusion weighting and is associated with the pulse gradient’s strength and duration, and provides two strong gradient pulses of amplitude (G) and duration (δ), as well as the time interval (Δ) between the gradients. In practice, this factor has been applied to generate diffusion-weighted images. Whereas b alternates by prolonging the separation of the two gradient pulses, this, in turn, allows water molecules to displace around more signal loss. The effect of diffusion is strongly influenced by the b-value and is amplified by increasing it. The formula for b specific to this particular implementation can only be seen in the Stejskal-Tanner pulsed gradient diffusion method, and the parameters are well demonstrated (Figure 1. A). Although the “optimal” choice of b-value is still challenging and undeniably depends on the field strength, several signals moderately predicted anatomical characteristics and pathology [6].
The amount of fractional anisotropy (FA) map is computed by an indicator called apparent diffusion coefficient (ADC), which largely represents the density of nerve fibers and has a value between 0 and 1 that zero appertains to the regions, such as CSF that no fiber tract exists and one belongs to a region that the compactness degree of fibers is high and in one direction. The strength and timing of the gradients exerted to produce diffusion-weighted images have been reflected by a factor named the b-value. The diffusion effects will be stronger if the b-value ascends to higher amounts. If the MR signal at baseline is and D is the diffusion coefficient, the signal (S) after the diffusion gradients are given by the Equation 1 [6]:
1. S=S0 e-bD
Biological tissues are highly anisotropic, which means their diffusion rates are not the same in all directions. For conventional DW imaging, this complexity was ignored, and diffusing was reduced to a single average value, the ADC, but this is oversimplified. In ADC, dark regions represent the regions with slower water diffusion. There are further obstacles to movement or augmented viscosity. Contrariwise the bright parts have a quicker diffusion, and the intensity of pixels is comparable to the extent of diffusion. Conversely, in diffusion-weighted imaging, a visible decrease in water diffusion in bright regions and increased water diffusion in dark regions are visible [6].
Diffusion anisotropy can be defined as any non-uniform pattern in water molecules diffusing in orderly structures, such as the brain. We can gauge the diffusion anisotropy by diffusion encoding gradients in at least six directions and procuring DWI. Also, we can compute the tensor and FA map of WMT and therewith display the tracts and their orientations [7]. An anisotropy map would address the white matter bundles in the human brain [8].
Water diffusion across human brain tissue depends on the environment proportion of intracellular water (vasogenic edema) versus extracellular water (cytotoxic edema), extracellular structures/large molecules, specifically in disease states, and physical orientation of tissue such as nerve fiber direction [6].
The tensor model is a model to describe data on anisotropic diffusion, which characterizes diffusion where the water molecules’ diffusion in each specific unit of time does not take place at a uniform rate in all directions. A three-dimensional diffusivity model in biological tissues has been considered a diffusion tensor (DT). In white matter, the major eigenvector, which is the direction of greatest diffusivity, is commonly supposed to be consistent with the fiber bundles’ direction [9].
The diffusion tensor matrix is defined by a 3x3 symmetrical matrix that characterizes the displacement in three dimensions or is compatible with diffusion rates in each combination of directions [6] (Equation 2):
.jpg)
The three diagonal elements (Dxx, Dyy, Dzz) represent diffusion coefficients measured along with principal laboratory axes (x-, y- and z-). The correlation of random motions between each pair of main directions is reflected in the six off-diagonal terms (Dxy, Dyz, etc). etc.), except for the particular state of isotropic diffusion, for instance, in pure liquids that all the off-diagonal elements are equal to zero. The diagonal elements are all the same and equal the single diffusion coefficient, D, for the isotropic material (i.e. Dxx=Dyy=Dzz=D). The tensor and the ellipsoid matrix can be described by the size of the principles axes (eigenvalues) and the direction of the principles axes (eigenvectors), which are indicated by λ1, λ2, λ3 (Equation 3):
.jpg)
Where λ1, λ2, and λ3 have termed the diagonal values of the tensor, λ1 address the value of primary eigenvalue or maximum diffusivity (longitudinal diffusivity), and λ2 and λ3 provide the extent of diffusion transversally to the primary one (or so-called radial diffusivity in one plane and they are also linked to eigenvectors that are orthogonal to the primary one) [6].
There are different types of images we can obtain from white matter. One of them is mean diffusivity, where we can average diffusion at every voxel across traces independent of direction [6] (Equation 4).
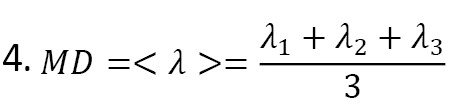
It naturally helps that CSF has the most signal due to having maximum diffusion, and the white matter has the least signal. The gray matter will have a much higher amount than the white matter. And FA is another indicator of diffusion anisotropy degree at each voxel evaluated by the tensor. The following formula [6] can calculate it (Equation 5):
.jpg)
FA has an amount between 0 and 1 where zero is related to the state of no fiber and no movement in no direction, namely, diffusion is spherical (i.e. isotropic). Vice versa 1 relevant to the condition of a series of fibers have been departing in the same direction; namely, diffusion is tubular (i.e. anisotropic). FA map is completely independent of direction, and FA increment in a region highly corresponds to an increase in the integrity of white matter. In other words, we can bring up isotropic and anisotropic diffusion as two different definitions for indices of diffusion, which are named diffusivity and fractional anisotropy, respectively. The addition of eigenvalues in mean diffusivity is equal to the mean directional diffusivity to calculate the overall diffusivity, while the difference in eigenvalues in fractional anisotropy is considered to compute directional diffusion. To interpret FA diffusivity and diffusivity, FA diffusivity highlights the size, number, and fiber’s myelination, while just FA provides insight toward directionality [10].
The distribution of major eigenvectors in the white matter has been investigated using color-based maps and WMT. Particular white matter structures, including the internal and external capsules, corona radiate, cingulum sagittal, stratum, and superior longitudinal fasciculus, revealed coherent patterns in the minor and medium eigenvector directions. The patterns mentioned above are consistent across subjects [8]. Color-coded FA map is another sign of white matter mapping, which is a more advanced step of a simple FA map, based on the principal diffusion direction and demonstrates the orientation of fibers. Besides the amount of diffusion, its direction of great significance, and accordingly, in x-direction reading from left to right, y-direction green anterior to posterior, and z-direction blue superior to inferior have been considered [9]. Beyond FA map, techniques, such as vector FA map which superimpose principal direction vector and by tracking these vectors, tracts will be obtainable, which is referred to as tractography [6].
Tractography techniques
In the current study, the extracted data by using imaging findings is recruited to identify fiber tracts’ location. In other words, our ultimate goal in DTI is tractography which means being precisely able to determine the directions. In this technique, corresponding voxels are linked in the direction of maximum diffusion. It must be kept in mind that these tracts have not necessarily extended or moved uniformly in one direction only. Fluctuations in motion of these fiber tracts are inevitable, and they must be accepted as one of the complications in tracking nerve fibers [11].
Due to uncertainties in the fiber tracking methods, several different techniques have been introduced for tractography, including streamline (deterministic), probabilistic and global tractography. Deterministic tractography or streamlining communicate neighboring voxels from seed regions (user-defined voxels), e.g. M1 for the contralesional corticospinal tract (CST). In this method, the user is allowed to determine the required regions to restrict the tract’s output, such as the internal capsule for the contralesional corticospinal tract (CST). Traced tracts pending termination criteria are yielded (such as the existence of a harsh angulation or declining anisotropy under a specified level). Accordingly, homogeneous and picturesque photos are acquired in this method. Concerning the background of this method, steering or propagation of streamlines, tensor deflection, tensorlines, and tract integration of fiber assignment by continuous tracking (FACT) , Euler and Runge Kutta are remarkable. On probabilistic or stochastic tractography, the value of each voxel in the map will be equivalent to the probability of the voxel considered in the diffusion path among the region of interests (ROIs). Mainly streamlines run for all voxels in the seed ROI. The technique mentioned above represents the quantitative probability of the link at each voxel and provides tracking into parts in which a low anisotropy, such as kissing fibers or crossing or does exist. Voxels with kissing geometries and voxels with crossing fibers or complex geometrical configurations can be challenging in diffusion MRI (dMRI) reconstruction and fiber tracking. In crossing or kissing fibers, FA is substantially low within the voxels of intersections [12]. Tractography of corticospinal tracts has been performed by both streamline and probabilistic techniques [13].
In global tractography, considerable ambiguities of tract solutions exist for complex fiber structure and orientation distribution function (ODF) helps, but ambiguities remain, and indeed finding the ‘optimal’ tractography solutions consistent with regional or global measurements have great significance. Global tractography algorithms consist of graph theory tractography min energy solution–2 regions, particle filtering, Gibbs tracking, spin glass model.
Diffusion models
Many studies have investigated the various types of diffusion models, including DTI, high angular resolution diffusion imaging (HARDI) containing a shell of diffusion weighting, spherical harmonic decomposition (SHD) of ADC, and q-ball, diffusion spectrum (q-space) imaging containing q-space imaging (qSI), diffusion spectrum imaging (DSI), cartesian q-space, hybrid diffusion imaging (HYDI) by, multiple shells, orientation distribution function, ODF and fiber ODF.
3. Results
Tractography errors
Different sources or factors are available for tractography errors. Among various factors influencing DTI accuracy, we can refer to cumulative tractography errors, heterogeneous tensor fields, including branches, crossing and adjacent WM tracts, existing false branching and termination containing branches, and crossing and adjacent WM tracts. In addition, visually apparent DTI artifacts can lead to tractography errors. And this issue has such importance that even small errors can have catastrophic results [14].
Utilizing diffusion tensor MR images in WMT promises a favorable and propitious technique for appraising white WMT pathways in the human brain. The accuracy of the WMT algorithms considerably affects the success of this method [15].
Comparison of tractography algorithms in a significant study named tensorlines performed by Weinstein et al. that considered different coefficients applied in the following equation based on various techniques [14].
Tensorlines
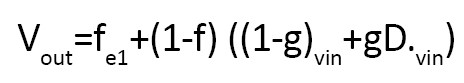
Streamlines (f=1, g=0), deflection (f=0, g=1), stiff deflection (f=0, g=0.3)
Tractogram interpretation
Outstandingly, on how to interpret these pretty pictures, we should say that tractograms usually look realistic. Another momentous study was diffusion tensor MRI (DT-MRI) Alexander which investigated partial volume effects on anisotropy [16].
By recent developments in computational analysis of effective connectivity as well as diffusion-based imaging, we are observing the revitalization of Hodology, i.e. the science investigating connectional anatomy. The pretty pictures made by diffusion-based imaging mesmerize the people, but undoubtedly, it has specific limitations; hence, the underlying pitfalls and shortcomings must truly be considered. The tensor model does not perform well where fibers twist, kiss, splay, cross, branch, and regions in which false negatives or artefactual reconstructions of pathways may presumably occur. By profound looking at this issue, developing alternative approaches, such as probabilistic placenta accreta spectrum (PAS)-MRI, spherical harmonic deconvolution, q-ball imaging, diffusion spectrum imaging, and probabilistic diffusion tractography with multiple fiber orientations for analysis of the diffusion-weighted signal has remarkably been raised. Although no perfect solution exists to this problem, for instance, enabling to make a distinction between fibers crossing, bending, or kissing through a voxel is a challenge, and in fact, topological ambiguity would be a big obstacle. And definitely, another point would be false negatives as well as artefactual reconstructions in diffusion-based imaging tractography, and specifically, there are some regions in which DTI tractography cannot visualize false negatives [17].
Tract dispersion
The axial diffusion asymmetry or orthogonal may be clarified by diverging, merging, or crossing fiber geometries. White Matter axial asymmetry must yield anisotropic dispersion patterns in the expected tract trajectories. The minor and medium eigenvector patterns are useful to clarify the local dispersion distributions of WMT [16].
Distance, signal-to-noise ratio (SNR) and anisotropy, and tract orientation in terms of having an encoding scheme impress on tract dispersion so that it grows by distance whilst diminished by SNR and anisotropy. Besides, divergency in tract geometries in, opposite to convergency that detracts dispersion, leads to an increment in tract dispersion [15]. Analytic models of tract dispersion were constructed as a function of the tract distance, SNR, eigenvalues of the tracts, voxel size, and the relationship between the tract direction and the diffusion tensor encoding directions. A sample of these types of models is shown in Lazar and Alexander Neuroimaging.
Estimating tract confidence
Among the crucial different methods of DTI analysis, especially tract confidence estimation, which has been proposed in recent years, including several models presented by Lazar and Alexander Neuroimage, probabilistic tractography, bootstrap tractography, multisubject tractography analysis have worth to be mentioned. All these efforts have been planned to perform a more precise DTI. Some of these techniques are physics-based, meaning that they examine the motion of molecules in terms of physicality and optimal energy consumption; physical equations have been introduced into computations, and based on them, the most promising path is anticipated. However, the other methods emphasize that there are a series of atlas-based information that guide us in moving molecules, and provides a more realistic photo [18].
Examples of prominent studies in this field, including probabilistic tractography, small angular perturbations are added at each ‘step’–probabilistic index of connectivity (PICo); FSL (Furniture Symbol Library (space planning software) also the approach of RAVE (random vector) perturbation that from a single seed multiple pathways are generated by calculating a perturbed eigenvector direction at discrete points along the trajectory can be mentioned. Additionally, in bootstrap tractography, the non-parametric distribution estimation method, which iterative resampling with replacement–Efron, and DTI have been considered from outstanding studies’ projects. Boot-tractography requires 2+DTI data sets from the same session, tractography repeated from seed location with random resampling; moreover, wild bootstrap, and residual bootstrap can be enumerated. Furthermore, multi-subject tractography analysis is one kind of distinct mapping investigation where parcelate whole-brain tracts use the cortical template and co-register linearized tractography connection data between subjects. The highest connection probability can be illustrated by a composite map of the principal direction of water mobility in various areas.
Anatomical and functional parcellation
To represent anatomical and functional parcellation, freesurfer parcellation maps have been well developed. Free surfer separates gray matter and white matter from each other, and by performing complicated mathematics calculations to determine two important concepts, including cortical thickness and surface area, then by multiplying these two parameters, the cortical volume is estimated. A framework for modeling human connectome using dMRI has been produced. In cognitive neuroscience, by assisting the technology of the human connectome, it is possible to discrete the different regions that are interconnected [6].
Gibbs tracking raised that DWI signals correspond to the tract model where ‘fiber’ configurations are constructed using small line pieces, fiber geometry is used to generate synthetic DW data, synthetic data compared against measured DW data and fiber configuration is adjusted to obtain new solution and iterative optimization methods are used to maximize consistency between measured data and tracts.
Validation or proving the validity or accuracy of mapping, distinction synthetic and phantom data from real ones, meanwhile comparing with tracer studies would be a beneficial advantage. There are two main stratagems, including ROI based approach, which evaluates the tracts entered or left in a specific seed, and the whole brain for tracking axonal fibers, that any of them will be advantageous in its specific situation. ROI-based approach by appraising the tracts entered or left in a specific seed precisely assesses these tracts [19]. Fiber clustering is mainly considered an automated instrument separating fibers based on their projections and shape. Among uncinate fasciculus, frontotemporal connections, and inferior fronto-occipital fasciculus (IFOF) is scarcely observed in the literature (adapted from gray’s anatomy) [16].
4. Discussion
Clinical aspects and applicable tractography in diseases
Tractography, neurosurgery, and brain tumors
Certainly, one of the most significant applications of DTI in Neurosurgery is when we face brain tumors; it can be considered a big challenge for this imaging technique because the existence of any legion among these fiber tracts can disturb the ordinary equations.
White matter fiber tracts and schizophrenia
In MRI structural studies, deficits related to gray matter have been largely reported but abnormalities concerning white matter are less apparent. Eminently functional abnormalities have been addressed in diverse brain regions and different settings using PET and fMRI. Admittedly, schizophrenia should be considered when different brain regions are disconnected. Besides, there appear to be distinct corpus callosum abnormalities in autism [20].
The most eminent connection between limbic structures consists of the cingulum bundle, which consolidates information by interconnecting the thalamus, parietal, prefrontal, and temporal lobes, including the hippocampus and amygdala parahippocampal gyrus with the cingulate gyrus. Verily combining this information into a more effective, or coherent whole makes this stronger. Schizophrenia-related symptoms including thought disorder, disorganized behavior, flattening of affect, delusions, hallucinations, and lack of attention are often linked with cingulate dysfunction. In the viewpoint of anisotropy analysis, cingulate fasciculi (out of plane diffusion component) above the corpus callosum (in-plane component) are differentiable in diffusion tensor maps in patients with schizophrenia, especially in terms of the difference in the area of the bundle. According to a study, the left-sided cingulum bundle’s diffusion anisotropy in the schizophrenia population was recorded as 7.4% lower compared to normal comparison cases (mean of the percentage difference for all eight slices), while the right-sided cingulum bundle’s diffusion anisotropy was just 2% lower compared to normal cases. Thereupon, these results lead us to a relative anisotropy within the cingulate fasciculus [21].
To recap, most studies in this field consist of inter and intragroup comparisons and correlations in toxicities, diseases, and cognitive functions. Also, in traumatic brain injury, DTI can help find damaged tracts. Furthermore, in developmental studies and presurgical planning, DTI plays a unique role [22].
Fiber tractography
There are three various types of functional connectivity, including direct functional connectivity following partial correlation, functional connectivity by Pearson correlation, and the pseudo functional connectivity caused by their difference which was appraised by resting-state functional magnetic resonance imaging data in conjunction with structural connectivity specified by applying fiber tractography of DTI. It is noteworthy that these types of functional connectivity were assessed by patterns of structural connectivity, e.g. intra-/inter-hemispheric edges as well as topological edge types, and considering structural connectivity attributes (fiber lengths and streamline counts) in the rich club constitution. It is essential that, in addition to structural connectivity, the within-day mutability in functional connectivity and also connectivity patterns, particularly the direct functional connectivity among brain areas, contribute to constraining the strength of functional connectivity [23].
Fiber clustering
Nowadays, to cluster fibers, automated methods that can identify white matter bundles from large tractography datasets have several applications in neuroscience research. In addition, the fast fiber clustering (FFClust) method for large tractography datasets containing millions of fibers has been remarkably raised. These resulting clusters portray the whole set of main white matter fascicles existing on a brain. The study of these clusters is remarkable in several respects. Investigating the clusters in pathological brains can be propounded as to its significance at the individual level. At the population level, by processing and analysis of reproducible bundles, other post-processing algorithms can be performed to study brain connectivity and develop new white matter bundle atlases. The utility of compact clusters gives us benefits in identifying atlas bundles connecting different brain regions accurately [24].
Coregistration of MRI and diffusion tensor MRI (DTMRI)
To simultaneously perform the coregistration of MRI and DTMRI with no gradient DTI gray-aligned spoiled gradient recalled acquisition in the steady state (SPGR), in the 1st stage, initial coarse registration is performed manually using a slicer alignment module. Automatic fine registration with the registration module with mutual information, since the registration metric is done [25].
Non-linear registration module, i.e. Alexandre Guimond, Matthan Caan lean mass index (LMI), and Lifeng Liu calcineurin inhibitor (CNI), as well as coregistration of DTMRI (T2 baseline) and MRI (SPGR) were performed for qualitative evaluation. Measurements of absolute anisotropy (AA), fractional anisotropy (FA), ADC, and relative anisotropy (RA) are considered results of the coregistration pilot study.
Main challenges
One of the controversial issues in this technique of mapping is directionality. No certainty exists about the direction of movement in fibers. Also, if termination nodes of fibers in the vicinity of gray matter eliminate and seem to be fading, finding tracts between two regions of the cortex will be confusing.
Another critical challenge in DTI mapping is the detection of crossing fibers which strongly depends on utilizing some methods for rectifying anisotropy, including the Bi-tensor model, which is a model consisting of two tensor compartments with the same arbitrary orientations and shape. The above-mentioned model provides two different white matter bundles simultaneously in one voxel. Due to the presumed identical shape of each tensor, it also represents the same parameters as a tensor model. The volume fraction cannot help further analysis since it is affected by arbitrary partial volume impacts [26]. Additionally, there are some methods, such as high-angular resolution diffusion imaging (HARDI), such as q-ball imaging which reconstructs the diffusion ODF, a spherical function whose maxima correspond to the underlying fiber populations [27].
Registration and averaging, especially in a case of a group of subjects in the pilot, create challenges in this regard, techniques such as “tract-based spatial statistics”, improving the objectivity, sensitivity, and interpretability of multi-subject diffusion imaging analysis, can beneficial [28].
Undoubtedly, the presence of lesions, such as glioma as a brain tumor on the way of WMT can be considered a serious problem. The existence of anatomically intact fibers in eccentric-appearing areas of the brain can be detected in DT imaging. There is an ambiguity about whether the resection of impaired fibers eventuates in delicate postsurgical neurological deficits and needs more systematic investigation [29].
5. Conclusion
Modern oncologic neurosurgery is undoubtedly one of the main and vital goals to meticulously remove the maximum amount of tumoral tissue while maintaining brain function in or adjacent to the tumor region. fMRI was considered the most important step in the preoperative mapping of the cerebral cortex; nevertheless, this mapping never has the potential to provide an awareness of WMT, which could be involved in intrinsically invasive brain tumors.
The utilization of advances in diffusion-tensor (DT) imaging techniques considerably enables us to map the WMT in the normal brain. However, it is undeniable that DT imaging plays a vital role in the preoperative mapping of WMT concerning cerebral neoplasms. These amazing techniques impress the surgical decision.
Also, by acquiring major information, including the anatomical information about location, orientation, and projections of WMT, depending on the tumor’s characteristics and situation, making a judgment about evidence of WMT edema, displacement, infiltration, and disruption, with the assistance of DTI in each subject could be feasible. With significantly improved throughput, high-quality DTI results are more achievable due to the recent development of imaging technology.
Ethical Considerations
Compliance with ethical guidelines
This article is a review with no human or animal sample.
Funding
This research did not receive any grant from funding agencies in the public, commercial, or non-profit sectors.
Authors' contributions
All authors equally contributed to preparing this article.
Conflict of interest
The authors declared no conflict of interests.
Acknowledgment
The authors would like to offer their special thanks to Mohammad Mirahmadi Eraghi for proofreading and editing the language of the article.
References
Brain function is highly associated with the wiring between variant brain regions, and signals transported by the complex web of axons from one neuron to another. Apart from methods aiding in the detection of brain activation by functional MRI (fMRI), MRI is crucial because it offers a choice to measure the underlying anatomical connections, through which extremely fast interactions among neurons are possible. The neurons perform various functions in the brain. In a small region of white matter, the bundles of the axonal fibers are all aligned. The direction of such alignment can be gently measured using diffusion tensor imaging (DTI). Understanding the orientation of the fibers at each point is requisite to mapping the fiber tracts. This method uses the sensitivity of the magnetic resonance signal to the small random motions of water molecules. Due to the existence of diffusion in white matter fiber tracts, water molecules have more tendencies to displace along the fiber direction compared with a perpendicular direction; in which diffusion anisotropy has been specifically raised, and mapping the fiber orientation with DTI is possible. Considerably, besides mapping white matter fiber tracts, these methods can enable us to detect and characterize white matter disorders in disease [1].
DTI is a recently developed MRI technique that can measure macroscopic axonal organization in the nervous system, and it will be one of the noninvasive ways to understand brain structural connectivity [2]. DTI also provides image contrast using the directional diffusion rate of water molecules within the brain [3]. One of the pivotal aspects of applying DTTI is the visualization of white matter tractography (WMT) and fundamental aid in the surgical planning for patients with intrinsic brain tumors [4].
Tractography has been raised as a significant method to improve the extent of tumor resection that surely liaises with longer survival. However, there is always a probability of tumor relapse. Primarily, MRI by focusing on cortical structures can precisely illustrate brain tumors, also the connection of the tumor with crucial brain structures, including blood vessels, but about the subcortical gray matter and the urgent region surrounding tumors, there is an obvious weakness in indicating exact information about entanglement and entirety of WMT. Fortunately, diffusion anisotropy maps and DTI modality can obtain a wealth of information in the white-matter tracts [4].
The concentration of this article is on DTI quiddity, its particular computational techniques, investigating its precision and interpretation, clarification of these WMT dispersions, and assessment of tract confidence. Undoubtedly, having complete acquaintance with all these comprehensions equips the neurosurgeons for preoperative planning. Tractography analysis has been competently discussed in this paper as well. Furthermore, consideration of functional connectivity and fiber clusterization among large tractography datasets is discussed in our paper. The only confined clinical aspects of the application of tractography in diseases have been discussed.
2. Methods and Materials/Patients
Basic diffusion tensor imaging (DTI) concepts
DTI is a recently developed MRI technique that can measure macroscopic axonal organization in the nervous system, and it is one of the noninvasive ways to understand brain structural connectivity [2]. DTI also provides image contrast using the directional diffusion rate of water molecules within the brain. When we see white matter on the MRI, a homogeneous gelatinous substance exists called the white matter, and no information about nerve tracts is available. A creative method called DTI illustrates how the tracts of white matter get through the brain. Diffusion occurs due to Brownian motion and random thermal motion. This diffusion can be isotropic or anisotropic. There is high isotropic diffusivity in cerebrospinal fluid (CSF) and an isotropic diffusivity in the gray matter but high anisotropic diffusivity in the white matter. Image intensities are inversely proportional to water molecules in tissue and motion orientation. Despite naturally moving water molecules under Brownian motion in an isotropic medium, e.g. water glass, the diffusion in biological tissues is often anisotropic [5]. Low contingency to crossing a myelin membrane by a supposing molecule through the axon can be a sample in this case. It can be comprehended by applying a specific gradient in a given direction wherever the dark regions correspond to non-Brownian motion.
Anisotropy and diffusion tensors
DTI facilitates measuring the quantity of water diffusion within brain tissue. Three perpendicular vectors portray the diffusion of each image voxel. Indeed, isotropic diffusion corresponds to no restriction to water movements, including CSF and ventricles, while anisotropic diffusion corresponds to restricted water movement in one primary direction, including myelinated fibers.
The angular frequency of the MR signal (ω) and the magnitude of the magnetic field (B) are related by the equation of ω=γ B where the magnitude of the magnetic field (B) and the magnet strength (B0) have this relationship: B=(B0+G*distance). Also, in Figure 1.B.
B-value is a term 1st introduced in 1965 by Stejskal and Tanner in their pulsed gradient diffusion approach. It has been delineated as a basic technique for most modern diffusion-weighted image (DWI) pulse sequences. It particularly demonstrates the level of diffusion weighting and is associated with the pulse gradient’s strength and duration, and provides two strong gradient pulses of amplitude (G) and duration (δ), as well as the time interval (Δ) between the gradients. In practice, this factor has been applied to generate diffusion-weighted images. Whereas b alternates by prolonging the separation of the two gradient pulses, this, in turn, allows water molecules to displace around more signal loss. The effect of diffusion is strongly influenced by the b-value and is amplified by increasing it. The formula for b specific to this particular implementation can only be seen in the Stejskal-Tanner pulsed gradient diffusion method, and the parameters are well demonstrated (Figure 1. A). Although the “optimal” choice of b-value is still challenging and undeniably depends on the field strength, several signals moderately predicted anatomical characteristics and pathology [6].
The amount of fractional anisotropy (FA) map is computed by an indicator called apparent diffusion coefficient (ADC), which largely represents the density of nerve fibers and has a value between 0 and 1 that zero appertains to the regions, such as CSF that no fiber tract exists and one belongs to a region that the compactness degree of fibers is high and in one direction. The strength and timing of the gradients exerted to produce diffusion-weighted images have been reflected by a factor named the b-value. The diffusion effects will be stronger if the b-value ascends to higher amounts. If the MR signal at baseline is and D is the diffusion coefficient, the signal (S) after the diffusion gradients are given by the Equation 1 [6]:
1. S=S0 e-bD
Biological tissues are highly anisotropic, which means their diffusion rates are not the same in all directions. For conventional DW imaging, this complexity was ignored, and diffusing was reduced to a single average value, the ADC, but this is oversimplified. In ADC, dark regions represent the regions with slower water diffusion. There are further obstacles to movement or augmented viscosity. Contrariwise the bright parts have a quicker diffusion, and the intensity of pixels is comparable to the extent of diffusion. Conversely, in diffusion-weighted imaging, a visible decrease in water diffusion in bright regions and increased water diffusion in dark regions are visible [6].
Diffusion anisotropy can be defined as any non-uniform pattern in water molecules diffusing in orderly structures, such as the brain. We can gauge the diffusion anisotropy by diffusion encoding gradients in at least six directions and procuring DWI. Also, we can compute the tensor and FA map of WMT and therewith display the tracts and their orientations [7]. An anisotropy map would address the white matter bundles in the human brain [8].
Water diffusion across human brain tissue depends on the environment proportion of intracellular water (vasogenic edema) versus extracellular water (cytotoxic edema), extracellular structures/large molecules, specifically in disease states, and physical orientation of tissue such as nerve fiber direction [6].
The tensor model is a model to describe data on anisotropic diffusion, which characterizes diffusion where the water molecules’ diffusion in each specific unit of time does not take place at a uniform rate in all directions. A three-dimensional diffusivity model in biological tissues has been considered a diffusion tensor (DT). In white matter, the major eigenvector, which is the direction of greatest diffusivity, is commonly supposed to be consistent with the fiber bundles’ direction [9].
The diffusion tensor matrix is defined by a 3x3 symmetrical matrix that characterizes the displacement in three dimensions or is compatible with diffusion rates in each combination of directions [6] (Equation 2):
The three diagonal elements (Dxx, Dyy, Dzz) represent diffusion coefficients measured along with principal laboratory axes (x-, y- and z-). The correlation of random motions between each pair of main directions is reflected in the six off-diagonal terms (Dxy, Dyz, etc). etc.), except for the particular state of isotropic diffusion, for instance, in pure liquids that all the off-diagonal elements are equal to zero. The diagonal elements are all the same and equal the single diffusion coefficient, D, for the isotropic material (i.e. Dxx=Dyy=Dzz=D). The tensor and the ellipsoid matrix can be described by the size of the principles axes (eigenvalues) and the direction of the principles axes (eigenvectors), which are indicated by λ1, λ2, λ3 (Equation 3):
Where λ1, λ2, and λ3 have termed the diagonal values of the tensor, λ1 address the value of primary eigenvalue or maximum diffusivity (longitudinal diffusivity), and λ2 and λ3 provide the extent of diffusion transversally to the primary one (or so-called radial diffusivity in one plane and they are also linked to eigenvectors that are orthogonal to the primary one) [6].
There are different types of images we can obtain from white matter. One of them is mean diffusivity, where we can average diffusion at every voxel across traces independent of direction [6] (Equation 4).
It naturally helps that CSF has the most signal due to having maximum diffusion, and the white matter has the least signal. The gray matter will have a much higher amount than the white matter. And FA is another indicator of diffusion anisotropy degree at each voxel evaluated by the tensor. The following formula [6] can calculate it (Equation 5):
FA has an amount between 0 and 1 where zero is related to the state of no fiber and no movement in no direction, namely, diffusion is spherical (i.e. isotropic). Vice versa 1 relevant to the condition of a series of fibers have been departing in the same direction; namely, diffusion is tubular (i.e. anisotropic). FA map is completely independent of direction, and FA increment in a region highly corresponds to an increase in the integrity of white matter. In other words, we can bring up isotropic and anisotropic diffusion as two different definitions for indices of diffusion, which are named diffusivity and fractional anisotropy, respectively. The addition of eigenvalues in mean diffusivity is equal to the mean directional diffusivity to calculate the overall diffusivity, while the difference in eigenvalues in fractional anisotropy is considered to compute directional diffusion. To interpret FA diffusivity and diffusivity, FA diffusivity highlights the size, number, and fiber’s myelination, while just FA provides insight toward directionality [10].
The distribution of major eigenvectors in the white matter has been investigated using color-based maps and WMT. Particular white matter structures, including the internal and external capsules, corona radiate, cingulum sagittal, stratum, and superior longitudinal fasciculus, revealed coherent patterns in the minor and medium eigenvector directions. The patterns mentioned above are consistent across subjects [8]. Color-coded FA map is another sign of white matter mapping, which is a more advanced step of a simple FA map, based on the principal diffusion direction and demonstrates the orientation of fibers. Besides the amount of diffusion, its direction of great significance, and accordingly, in x-direction reading from left to right, y-direction green anterior to posterior, and z-direction blue superior to inferior have been considered [9]. Beyond FA map, techniques, such as vector FA map which superimpose principal direction vector and by tracking these vectors, tracts will be obtainable, which is referred to as tractography [6].
Tractography techniques
In the current study, the extracted data by using imaging findings is recruited to identify fiber tracts’ location. In other words, our ultimate goal in DTI is tractography which means being precisely able to determine the directions. In this technique, corresponding voxels are linked in the direction of maximum diffusion. It must be kept in mind that these tracts have not necessarily extended or moved uniformly in one direction only. Fluctuations in motion of these fiber tracts are inevitable, and they must be accepted as one of the complications in tracking nerve fibers [11].
Due to uncertainties in the fiber tracking methods, several different techniques have been introduced for tractography, including streamline (deterministic), probabilistic and global tractography. Deterministic tractography or streamlining communicate neighboring voxels from seed regions (user-defined voxels), e.g. M1 for the contralesional corticospinal tract (CST). In this method, the user is allowed to determine the required regions to restrict the tract’s output, such as the internal capsule for the contralesional corticospinal tract (CST). Traced tracts pending termination criteria are yielded (such as the existence of a harsh angulation or declining anisotropy under a specified level). Accordingly, homogeneous and picturesque photos are acquired in this method. Concerning the background of this method, steering or propagation of streamlines, tensor deflection, tensorlines, and tract integration of fiber assignment by continuous tracking (FACT) , Euler and Runge Kutta are remarkable. On probabilistic or stochastic tractography, the value of each voxel in the map will be equivalent to the probability of the voxel considered in the diffusion path among the region of interests (ROIs). Mainly streamlines run for all voxels in the seed ROI. The technique mentioned above represents the quantitative probability of the link at each voxel and provides tracking into parts in which a low anisotropy, such as kissing fibers or crossing or does exist. Voxels with kissing geometries and voxels with crossing fibers or complex geometrical configurations can be challenging in diffusion MRI (dMRI) reconstruction and fiber tracking. In crossing or kissing fibers, FA is substantially low within the voxels of intersections [12]. Tractography of corticospinal tracts has been performed by both streamline and probabilistic techniques [13].
In global tractography, considerable ambiguities of tract solutions exist for complex fiber structure and orientation distribution function (ODF) helps, but ambiguities remain, and indeed finding the ‘optimal’ tractography solutions consistent with regional or global measurements have great significance. Global tractography algorithms consist of graph theory tractography min energy solution–2 regions, particle filtering, Gibbs tracking, spin glass model.
Diffusion models
Many studies have investigated the various types of diffusion models, including DTI, high angular resolution diffusion imaging (HARDI) containing a shell of diffusion weighting, spherical harmonic decomposition (SHD) of ADC, and q-ball, diffusion spectrum (q-space) imaging containing q-space imaging (qSI), diffusion spectrum imaging (DSI), cartesian q-space, hybrid diffusion imaging (HYDI) by, multiple shells, orientation distribution function, ODF and fiber ODF.
3. Results
Tractography errors
Different sources or factors are available for tractography errors. Among various factors influencing DTI accuracy, we can refer to cumulative tractography errors, heterogeneous tensor fields, including branches, crossing and adjacent WM tracts, existing false branching and termination containing branches, and crossing and adjacent WM tracts. In addition, visually apparent DTI artifacts can lead to tractography errors. And this issue has such importance that even small errors can have catastrophic results [14].
Utilizing diffusion tensor MR images in WMT promises a favorable and propitious technique for appraising white WMT pathways in the human brain. The accuracy of the WMT algorithms considerably affects the success of this method [15].
Comparison of tractography algorithms in a significant study named tensorlines performed by Weinstein et al. that considered different coefficients applied in the following equation based on various techniques [14].
Tensorlines
Streamlines (f=1, g=0), deflection (f=0, g=1), stiff deflection (f=0, g=0.3)
Tractogram interpretation
Outstandingly, on how to interpret these pretty pictures, we should say that tractograms usually look realistic. Another momentous study was diffusion tensor MRI (DT-MRI) Alexander which investigated partial volume effects on anisotropy [16].
By recent developments in computational analysis of effective connectivity as well as diffusion-based imaging, we are observing the revitalization of Hodology, i.e. the science investigating connectional anatomy. The pretty pictures made by diffusion-based imaging mesmerize the people, but undoubtedly, it has specific limitations; hence, the underlying pitfalls and shortcomings must truly be considered. The tensor model does not perform well where fibers twist, kiss, splay, cross, branch, and regions in which false negatives or artefactual reconstructions of pathways may presumably occur. By profound looking at this issue, developing alternative approaches, such as probabilistic placenta accreta spectrum (PAS)-MRI, spherical harmonic deconvolution, q-ball imaging, diffusion spectrum imaging, and probabilistic diffusion tractography with multiple fiber orientations for analysis of the diffusion-weighted signal has remarkably been raised. Although no perfect solution exists to this problem, for instance, enabling to make a distinction between fibers crossing, bending, or kissing through a voxel is a challenge, and in fact, topological ambiguity would be a big obstacle. And definitely, another point would be false negatives as well as artefactual reconstructions in diffusion-based imaging tractography, and specifically, there are some regions in which DTI tractography cannot visualize false negatives [17].
Tract dispersion
The axial diffusion asymmetry or orthogonal may be clarified by diverging, merging, or crossing fiber geometries. White Matter axial asymmetry must yield anisotropic dispersion patterns in the expected tract trajectories. The minor and medium eigenvector patterns are useful to clarify the local dispersion distributions of WMT [16].
Distance, signal-to-noise ratio (SNR) and anisotropy, and tract orientation in terms of having an encoding scheme impress on tract dispersion so that it grows by distance whilst diminished by SNR and anisotropy. Besides, divergency in tract geometries in, opposite to convergency that detracts dispersion, leads to an increment in tract dispersion [15]. Analytic models of tract dispersion were constructed as a function of the tract distance, SNR, eigenvalues of the tracts, voxel size, and the relationship between the tract direction and the diffusion tensor encoding directions. A sample of these types of models is shown in Lazar and Alexander Neuroimaging.
Estimating tract confidence
Among the crucial different methods of DTI analysis, especially tract confidence estimation, which has been proposed in recent years, including several models presented by Lazar and Alexander Neuroimage, probabilistic tractography, bootstrap tractography, multisubject tractography analysis have worth to be mentioned. All these efforts have been planned to perform a more precise DTI. Some of these techniques are physics-based, meaning that they examine the motion of molecules in terms of physicality and optimal energy consumption; physical equations have been introduced into computations, and based on them, the most promising path is anticipated. However, the other methods emphasize that there are a series of atlas-based information that guide us in moving molecules, and provides a more realistic photo [18].
Examples of prominent studies in this field, including probabilistic tractography, small angular perturbations are added at each ‘step’–probabilistic index of connectivity (PICo); FSL (Furniture Symbol Library (space planning software) also the approach of RAVE (random vector) perturbation that from a single seed multiple pathways are generated by calculating a perturbed eigenvector direction at discrete points along the trajectory can be mentioned. Additionally, in bootstrap tractography, the non-parametric distribution estimation method, which iterative resampling with replacement–Efron, and DTI have been considered from outstanding studies’ projects. Boot-tractography requires 2+DTI data sets from the same session, tractography repeated from seed location with random resampling; moreover, wild bootstrap, and residual bootstrap can be enumerated. Furthermore, multi-subject tractography analysis is one kind of distinct mapping investigation where parcelate whole-brain tracts use the cortical template and co-register linearized tractography connection data between subjects. The highest connection probability can be illustrated by a composite map of the principal direction of water mobility in various areas.
Anatomical and functional parcellation
To represent anatomical and functional parcellation, freesurfer parcellation maps have been well developed. Free surfer separates gray matter and white matter from each other, and by performing complicated mathematics calculations to determine two important concepts, including cortical thickness and surface area, then by multiplying these two parameters, the cortical volume is estimated. A framework for modeling human connectome using dMRI has been produced. In cognitive neuroscience, by assisting the technology of the human connectome, it is possible to discrete the different regions that are interconnected [6].
Gibbs tracking raised that DWI signals correspond to the tract model where ‘fiber’ configurations are constructed using small line pieces, fiber geometry is used to generate synthetic DW data, synthetic data compared against measured DW data and fiber configuration is adjusted to obtain new solution and iterative optimization methods are used to maximize consistency between measured data and tracts.
Validation or proving the validity or accuracy of mapping, distinction synthetic and phantom data from real ones, meanwhile comparing with tracer studies would be a beneficial advantage. There are two main stratagems, including ROI based approach, which evaluates the tracts entered or left in a specific seed, and the whole brain for tracking axonal fibers, that any of them will be advantageous in its specific situation. ROI-based approach by appraising the tracts entered or left in a specific seed precisely assesses these tracts [19]. Fiber clustering is mainly considered an automated instrument separating fibers based on their projections and shape. Among uncinate fasciculus, frontotemporal connections, and inferior fronto-occipital fasciculus (IFOF) is scarcely observed in the literature (adapted from gray’s anatomy) [16].
4. Discussion
Clinical aspects and applicable tractography in diseases
Tractography, neurosurgery, and brain tumors
Certainly, one of the most significant applications of DTI in Neurosurgery is when we face brain tumors; it can be considered a big challenge for this imaging technique because the existence of any legion among these fiber tracts can disturb the ordinary equations.
White matter fiber tracts and schizophrenia
In MRI structural studies, deficits related to gray matter have been largely reported but abnormalities concerning white matter are less apparent. Eminently functional abnormalities have been addressed in diverse brain regions and different settings using PET and fMRI. Admittedly, schizophrenia should be considered when different brain regions are disconnected. Besides, there appear to be distinct corpus callosum abnormalities in autism [20].
The most eminent connection between limbic structures consists of the cingulum bundle, which consolidates information by interconnecting the thalamus, parietal, prefrontal, and temporal lobes, including the hippocampus and amygdala parahippocampal gyrus with the cingulate gyrus. Verily combining this information into a more effective, or coherent whole makes this stronger. Schizophrenia-related symptoms including thought disorder, disorganized behavior, flattening of affect, delusions, hallucinations, and lack of attention are often linked with cingulate dysfunction. In the viewpoint of anisotropy analysis, cingulate fasciculi (out of plane diffusion component) above the corpus callosum (in-plane component) are differentiable in diffusion tensor maps in patients with schizophrenia, especially in terms of the difference in the area of the bundle. According to a study, the left-sided cingulum bundle’s diffusion anisotropy in the schizophrenia population was recorded as 7.4% lower compared to normal comparison cases (mean of the percentage difference for all eight slices), while the right-sided cingulum bundle’s diffusion anisotropy was just 2% lower compared to normal cases. Thereupon, these results lead us to a relative anisotropy within the cingulate fasciculus [21].
To recap, most studies in this field consist of inter and intragroup comparisons and correlations in toxicities, diseases, and cognitive functions. Also, in traumatic brain injury, DTI can help find damaged tracts. Furthermore, in developmental studies and presurgical planning, DTI plays a unique role [22].
Fiber tractography
There are three various types of functional connectivity, including direct functional connectivity following partial correlation, functional connectivity by Pearson correlation, and the pseudo functional connectivity caused by their difference which was appraised by resting-state functional magnetic resonance imaging data in conjunction with structural connectivity specified by applying fiber tractography of DTI. It is noteworthy that these types of functional connectivity were assessed by patterns of structural connectivity, e.g. intra-/inter-hemispheric edges as well as topological edge types, and considering structural connectivity attributes (fiber lengths and streamline counts) in the rich club constitution. It is essential that, in addition to structural connectivity, the within-day mutability in functional connectivity and also connectivity patterns, particularly the direct functional connectivity among brain areas, contribute to constraining the strength of functional connectivity [23].
Fiber clustering
Nowadays, to cluster fibers, automated methods that can identify white matter bundles from large tractography datasets have several applications in neuroscience research. In addition, the fast fiber clustering (FFClust) method for large tractography datasets containing millions of fibers has been remarkably raised. These resulting clusters portray the whole set of main white matter fascicles existing on a brain. The study of these clusters is remarkable in several respects. Investigating the clusters in pathological brains can be propounded as to its significance at the individual level. At the population level, by processing and analysis of reproducible bundles, other post-processing algorithms can be performed to study brain connectivity and develop new white matter bundle atlases. The utility of compact clusters gives us benefits in identifying atlas bundles connecting different brain regions accurately [24].
Coregistration of MRI and diffusion tensor MRI (DTMRI)
To simultaneously perform the coregistration of MRI and DTMRI with no gradient DTI gray-aligned spoiled gradient recalled acquisition in the steady state (SPGR), in the 1st stage, initial coarse registration is performed manually using a slicer alignment module. Automatic fine registration with the registration module with mutual information, since the registration metric is done [25].
Non-linear registration module, i.e. Alexandre Guimond, Matthan Caan lean mass index (LMI), and Lifeng Liu calcineurin inhibitor (CNI), as well as coregistration of DTMRI (T2 baseline) and MRI (SPGR) were performed for qualitative evaluation. Measurements of absolute anisotropy (AA), fractional anisotropy (FA), ADC, and relative anisotropy (RA) are considered results of the coregistration pilot study.
Main challenges
One of the controversial issues in this technique of mapping is directionality. No certainty exists about the direction of movement in fibers. Also, if termination nodes of fibers in the vicinity of gray matter eliminate and seem to be fading, finding tracts between two regions of the cortex will be confusing.
Another critical challenge in DTI mapping is the detection of crossing fibers which strongly depends on utilizing some methods for rectifying anisotropy, including the Bi-tensor model, which is a model consisting of two tensor compartments with the same arbitrary orientations and shape. The above-mentioned model provides two different white matter bundles simultaneously in one voxel. Due to the presumed identical shape of each tensor, it also represents the same parameters as a tensor model. The volume fraction cannot help further analysis since it is affected by arbitrary partial volume impacts [26]. Additionally, there are some methods, such as high-angular resolution diffusion imaging (HARDI), such as q-ball imaging which reconstructs the diffusion ODF, a spherical function whose maxima correspond to the underlying fiber populations [27].
Registration and averaging, especially in a case of a group of subjects in the pilot, create challenges in this regard, techniques such as “tract-based spatial statistics”, improving the objectivity, sensitivity, and interpretability of multi-subject diffusion imaging analysis, can beneficial [28].
Undoubtedly, the presence of lesions, such as glioma as a brain tumor on the way of WMT can be considered a serious problem. The existence of anatomically intact fibers in eccentric-appearing areas of the brain can be detected in DT imaging. There is an ambiguity about whether the resection of impaired fibers eventuates in delicate postsurgical neurological deficits and needs more systematic investigation [29].
5. Conclusion
Modern oncologic neurosurgery is undoubtedly one of the main and vital goals to meticulously remove the maximum amount of tumoral tissue while maintaining brain function in or adjacent to the tumor region. fMRI was considered the most important step in the preoperative mapping of the cerebral cortex; nevertheless, this mapping never has the potential to provide an awareness of WMT, which could be involved in intrinsically invasive brain tumors.
The utilization of advances in diffusion-tensor (DT) imaging techniques considerably enables us to map the WMT in the normal brain. However, it is undeniable that DT imaging plays a vital role in the preoperative mapping of WMT concerning cerebral neoplasms. These amazing techniques impress the surgical decision.
Also, by acquiring major information, including the anatomical information about location, orientation, and projections of WMT, depending on the tumor’s characteristics and situation, making a judgment about evidence of WMT edema, displacement, infiltration, and disruption, with the assistance of DTI in each subject could be feasible. With significantly improved throughput, high-quality DTI results are more achievable due to the recent development of imaging technology.
Ethical Considerations
Compliance with ethical guidelines
This article is a review with no human or animal sample.
Funding
This research did not receive any grant from funding agencies in the public, commercial, or non-profit sectors.
Authors' contributions
All authors equally contributed to preparing this article.
Conflict of interest
The authors declared no conflict of interests.
Acknowledgment
The authors would like to offer their special thanks to Mohammad Mirahmadi Eraghi for proofreading and editing the language of the article.
References
- Kubicki M, McCarley R, Westin CF, Park HJ, Maier S, Kikinis R, et al. A review of diffusion tensor imaging studies in schizophrenia. Journal of Psychiatric Research. 2007; 41(1-2):15-30. [DOI:10.1016/j.jpsychires.2005.05.005] [PMID] [PMCID]
- Mori S, Zhang J. Principles of diffusion tensor imaging and its applications to basic neuroscience research. Neuron. 2006; 51(5):527-39. [DOI:10.1016/j.neuron.2006.08.012] [PMID]
- Huisman TA. Diffusion-weighted and diffusion tensor imaging of the brain, made easy. Cancer Imaging. 2010; 10 (1A):S163-71 [DOI:10.1102/1470-7330.2010.9023] [PMID] [PMCID]
- Iliescu BD, Poeata N. MR tractography for preoperative planning in patients with cerebral tumors in eloquent areas. Romanian Neurosurgery. 2010; 17(4):413-20. [Link]
- Ahmad F, Abbassi F, Ul-Islam M, Jacquemin F, Hong JW. Enhanced impact-resistance of aeronautical quasi-isotropic composite plates through diffused water molecules in epoxy. Scientific Reports. 2021; 11(1):1775. [DOI:10.1038/s41598-021-81443-w] [PMID] [PMCID]
- No author. Welcome to the questions and answers in MRI website [Internet]. 2023 [Updated 2023 January 7]. Available from: [Link]
- Farshidfar Z, Faeghi F, Mohseni M, Seddighi A, Kharrazi HH, Abdolmohammadi J. Diffusion tensor tractography in the presurgical assessment of cerebral gliomas. The Neuroradiology Journal. 2014; 27(1):75-84. [DOI:10.15274/NRJ-2014-10008] [PMID] [PMCID]
- Kubicki M, Westin CF, Maier SE, Frumin M, Nestor PG, Salisbury D, et al. Uncinate fasciculus findings in schizophrenia: A magnetic resonance diffusion tensor imaging study. American Journal of Psychiatry. 2002; 159(5):813-20. [DOI:10.1176/appi.ajp.159.5.813] [PMID] [PMCID]
- Lazar M, Lee JH, Alexander AL. Axial asymmetry of water diffusion in brain white matter. Magnetic Resonance in Medicine. 2005; 54(4):860-7.[DOI:10.1002/mrm.20653] [PMID]
- Clayden JD. Imaging connectivity: MRI and the structural networks of the brain. Functional Neurology. 2013; 28(3):197-203. [PMID] [PMCID]
- Stein D, Assaf Y, Dar G, Cohen H, Slon V, Kedar E, et al. 3d virtual reconstruction and quantitative assessment of the human intervertebral disc's annulus fibrosus: A DTI tractography study. Scientific Reports. 2021; 11(1):6815. [DOI:10.1038/s41598-021-86334-8] [PMID] [PMCID]
- Schilling K, Gao Y, Janve V, Stepniewska I, Landman BA, Anderson AW. Can increased spatial resolution solve the crossing fiber problem for diffusion MRI? NMR in Biomedicine. 2017; 30(12):10.1002/nbm.3787. [DOI:10.1002/nbm.3787] [PMID] [PMCID]
- Nucifora PG, Verma R, Lee SK, Melhem ER. Diffusion-tensor MR imaging and tractography: Exploring brain microstructure and connectivity. Radiology. 2007; 245(2):367-84. [DOI:10.1148/radiol.2452060445] [PMID]
- Lazar M. Mapping brain anatomical connectivity using white matter tractography. NMR in Biomedicine. 2010; 23(7):821-35. [DOI:10.1002/nbm.1579] [PMID] [PMCID]
- Lazar M, Alexander AL. An error analysis of white matter tractography methods: Synthetic diffusion tensor field simulations. NeuroImage. 2003; 20(2):1140-53. [DOI:10.1016/S1053-8119(03)00277-5]
- Jeurissen B, Descoteaux M, Mori S, Leemans A. Diffusion MRI fiber tractography of the brain. NMR in Biomedicine. 2019; 32(4):e3785.[DOI:10.1002/nbm.3785] [PMID]
- Kubicki M, McCarley RW, Shenton ME. Evidence for white matter abnormalities in schizophrenia. Current Opinion in Psychiatry. 2005; 18(2):121-34. [DOI:10.1097/00001504-200503000-00004] [PMID] [PMCID]
- Catani M. From hodology to function. Brain. 2007; 130(Pt 3):602-5. [DOI:10.1093/brain/awm008] [PMID]
- Rykhlevskaia E, Uddin LQ, Kondos L, Menon V. Neuroanatomical correlates of developmental dyscalculia: Combined evidence from morphometry and tractography. Frontiers in Human Neuroscience. 2009; 3:51. [DOI:10.3389/neuro.09.051.2009] [PMID] [PMCID]
- Park HJ, Westin CF, Kubicki M, Maier SE, Niznikiewicz M, Baer A, et al. White matter hemisphere asymmetries in healthy subjects and in schizophrenia: A diffusion tensor MRI study. NeuroImage. 2004; 23(1):213-23. [DOI:10.1016/j.neuroimage.2004.04.036] [PMID] [PMCID]
- Jung K, Eickhoff SB, Popovych OV. Tractography density affects whole-brain structural architecture and resting-state dynamical modeling. NeuroImage. 2021; 237:118176. [DOI:10.1016/j.neuroimage.2021.118176] [PMID]
- Leote J, Nunes RG, Cerqueira L, Loução R, Ferreira HA. Reconstruction of white matter fibre tracts using diffusion kurtosis tensor imaging at 1.5T: Pre-surgical planning in patients with gliomas. European Journal of Radiology Open. 2018; 5:20-23. [DOI:10.1016/j.ejro.2018.01.002] [PMID] [PMCID]
- Park B, Eo J, Park HJ. Structural brain connectivity constrains within-a-day variability of direct functional connectivity. Frontiers in Human Neuroscience. 2017; 11:408.[DOI:10.3389/fnhum.2017.00408] [PMID] [PMCID]
- Vázquez A, López-López N, Sánchez A, Houenou J, Poupon C, Mangin JF, et al. FFClust: Fast fiber clustering for large tractography datasets for a detailed study of brain connectivity. NeuroImage. 2020; 220:117070. [DOI:10.1016/j.neuroimage.2020.117070] [PMID]
- Kiebel SJ, Ashburner J, Poline JB, Friston KJ. MRI and PET coregistration--a cross validation of statistical parametric mapping and automated image registration. NeuroImage. 1997; 5(4 Pt 1):271-9. [DOI:10.1006/nimg.1997.0265] [PMID]
- Filatova OG, van Vliet LJ, Schouten AC, Kwakkel G, van der Helm FCT, Vos FM. Comparison of multi-tensor diffusion models' performance for white matter integrity estimation in chronic stroke. Frontiers in Neuroscience. 2018; 12:247. [DOI:10.3389/fnins.2018.00247] [PMID] [PMCID]
- Wassermann D, Descoteaux M, Deriche R. Diffusion maps clustering for magnetic resonance q-ball imaging segmentation. International Journal of Biomedical Imaging. 2008; 2008:526906. [DOI:10.1155/2008/526906] [PMID] [PMCID]
- Smith SM, Jenkinson M, Johansen-Berg H, Rueckert D, Nichols TE, Mackay CE, et al. Tract-based spatial statistics: Voxelwise analysis of multi-subject diffusion data. NeuroImage. 2006; 31(4):1487-505. [DOI:10.1016/j.neuroimage.2006.02.024] [PMID]
- Essayed WI, Zhang F, Unadkat P, Cosgrove GR, Golby AJ, O'Donnell LJ. White matter tractography for neurosurgical planning: A topography-based review of the current state of the art. NeuroImage: Clinical. 2017; 15:659-72. [DOI:10.1016/j.nicl.2017.06.011] [PMID] [PMCID]
Type of Study: Review |
Subject:
Functional Neurosurgery
Send email to the article author
| Rights and Permissions | |
 |
This work is licensed under a Creative Commons Attribution-NonCommercial 4.0 International License. |
Copyright © The Author(s);
This is an open access article distributed under the terms of the Creative Commons Attribution License (CC-By-NC), which permits use, distribution, and reproduction in any medium, provided the original work is properly cited and is not used for commercial purposes.
Contact Information
This is an open access article distributed under the terms of the Creative Commons Attribution License (CC-By-NC), which permits use, distribution, and reproduction in any medium, provided the original work is properly cited and is not used for commercial purposes.
Contact Information
